Thousands of Homes Face Safety Challenges

Over 800,000 Northern homes have serious hazards at a cost of £3.15 billion to put right.
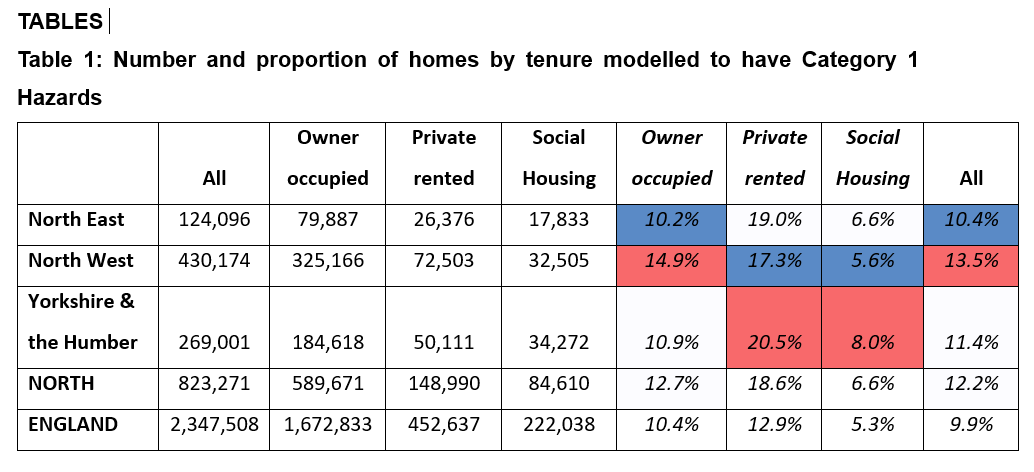
On average one in ten (9.9 %) of the occupied homes in England have a Category 1 Hazard.
Research for the new Northern Housing Monitor, a ‘state of the region’ report for housing in the North, finds that, over 823,000 Northern homes are modelled as having a Category 1 Hazard.
In the North West, almost one in every seven homes has a hazard, one in nine in Yorkshire & the Humber and over one in ten in the North East.
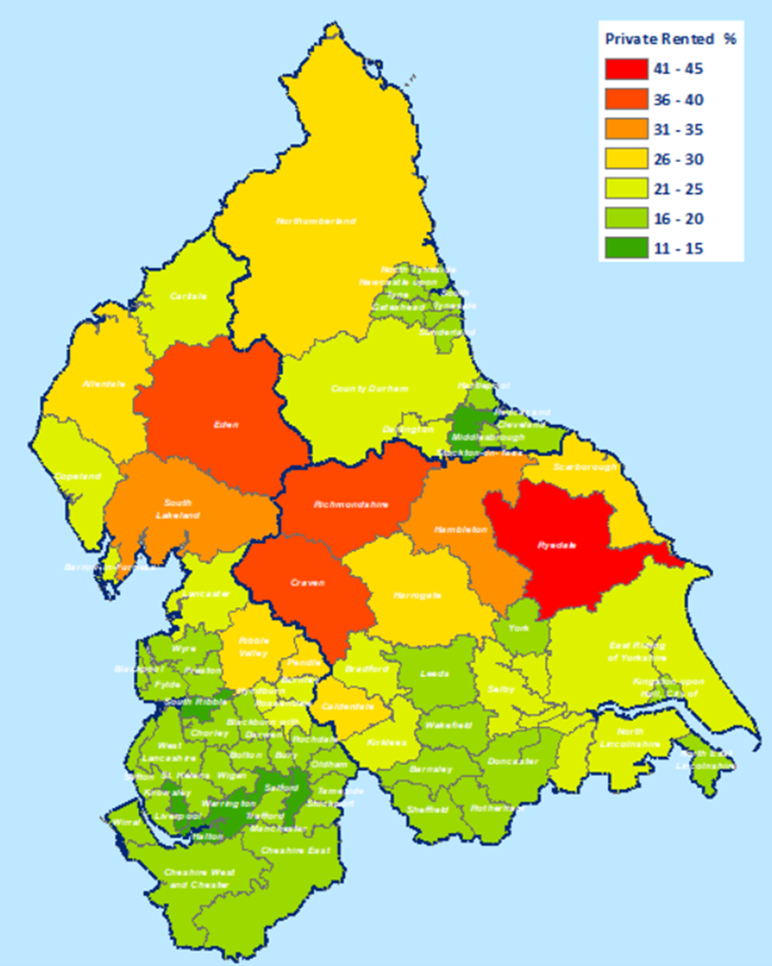
Private renting is consistently the tenure most likely to be modelled for a hazard:
- Between one in five and one in six privately rented homes have a Category 1 Hazard
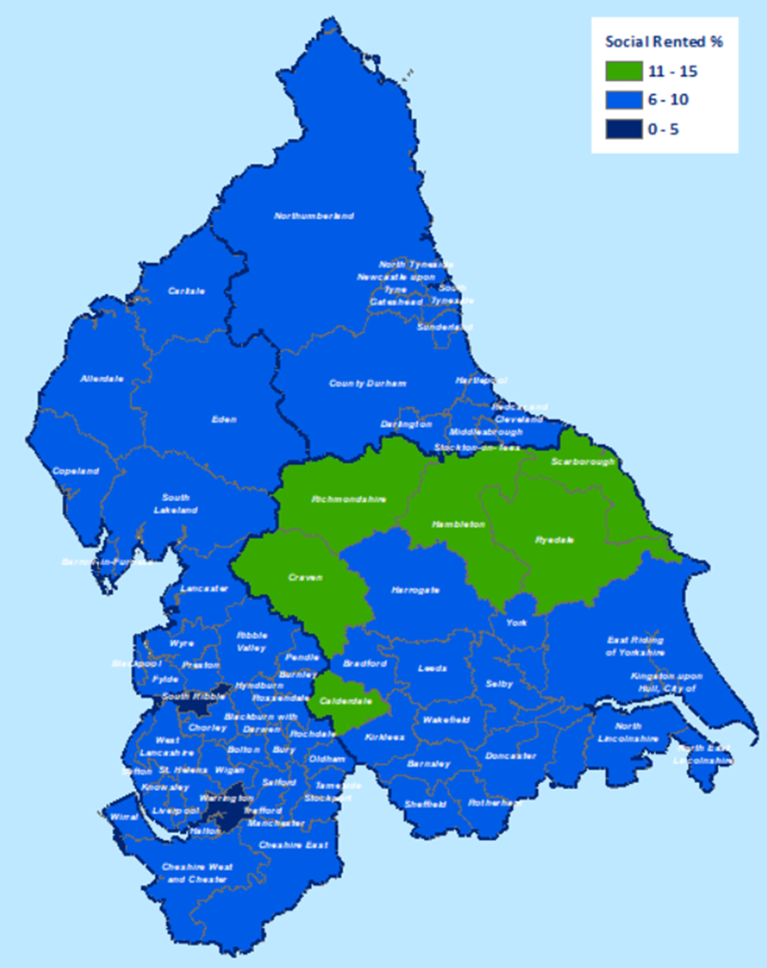
- Social housing has the overall best quality tenure at around a third better than the all-tenure average. Owner occupied homes are also much less likely to have a serious problem than in the private rented sector.
The most common Category 1 hazards found in homes are excess cold, damp and mould growth, fire, falls on stairs, and electrical hazards.
The government and the local authorities have been taking measures to improve the quality and safety of housing and to reduce the number of Category 1 hazards in homes.
What would it cost to put this right and what would the wider benefits be?
- Using estimates of the cost to resolve Category 1 hazards published by the independent BRE Trust in July 2023 pro rata, the costs would be about £3.15 billion in the North.
- Whilst a huge bill, which would take about nine years before it was paid back, this investment would be good business for the tax-payer. These faults cost the NHS £350 million pro rata a year in the North. Nationally, the wider benefits reach about £130 billion over 30 years (ten times the NHS benefits) and would include reducing CO2 emissions by 97 million tonnes.
- Pro rata these benefits for the North would be in the region of £44 billion and 34 million tonnes of emissions reduced.
Hotspots are largely rural
Rural areas in the North of England have proportions of the most dangerous hazards across all dwellings that are approximately double the England average.
- Seven of the top ten most challenged local authority areas in England are located in these rural areas.
Terraces dominate the house types with hazards in the North
Of the 823,000 homes in the North with hazards, by far the largest type are terraces with a 40.8% share, followed by semi-detached homes. Flats were a distant third at 16.3%.
- Hazards appear to broadly follow a pattern of income distribution assumed by bungalows and detached homes occupying more land (and thereby costing more) with terraces and flats being the least expensive units to occupy on the whole.
- Terraces are substantially more likely to be assessed as hazardous in the North, with North West terraces being proportionately over half more likely to have a hazard compared with the English average.
- The North East does not follow the England distribution, with its flats being more than twice as likely to be modelled with a hazard than flats overall in England. Conversely, the very low value for terraces in the region probably reflects the post-war replacement of obsolete or destroyed terraces within public stock.
The research above is extracted from the new edition of the Northern Housing Monitor for 2023 – the full document will be launched in autumn 2023 – keep a look out in Member News for launch dates.
NOTES
WHAT ARE HAZARDS IN THE HOME?
The housing health and safety rating system (HHSRS) is a risk-based evaluation tool to help local authorities identify and protect against potential risks and hazards to health and safety from any deficiencies identified in dwellings. It was introduced under the Housing Act 2004.
There are 29 categories of housing hazard with a category 1 hazard the most serious hazard which could pose the most serious risk of harm. Some examples of category 1 hazards are excess cold, damp and mould growth, falls on stairs and other trip hazards.
A review of the HHSRS was commissioned by DLUHC to clarify and modernise the HHSRS assessment and consider whether some hazard profiles could be removed or combined and to improve the guidance given to landlords and tenants. The review is nearing completion and the Government will publish a summary of the findings and set out next steps.
DATA MODELLING
This data is extracted from the English Housing Survey local authority level stock modelling undertaken by BRE Group’s Local Government Data & Insights team, on behalf of DLUHC.
English Housing Survey Local Authority Stock Condition Modelling of HHSRS Category 1 Hazards has modelled the most recent pre-Covid data down to local authority level. Known characteristics associated with unsafe dwellings have been used to estimate the number of homes in an area that would likely fail a HHSRS assessment in the North. This is experimental data released in June 2023.
TABLES
Cells are shaded horizontally, red being the highest.
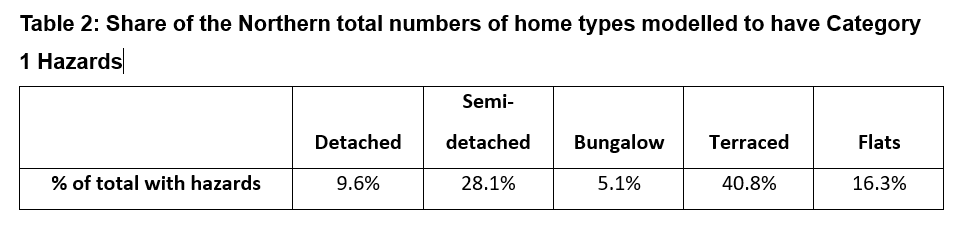
Table 3: Number and proportion of homes modelled to have Category 1 Hazards
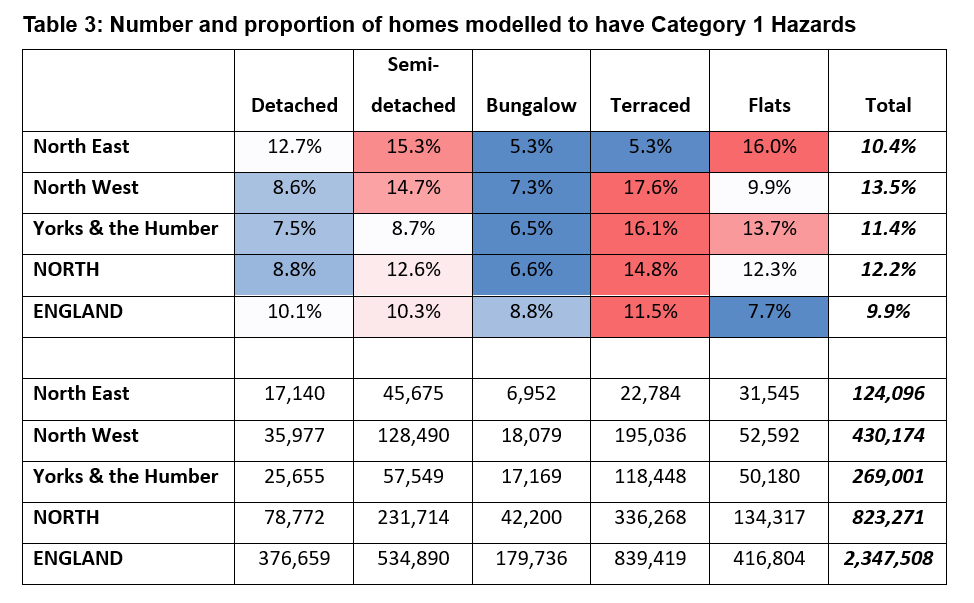
Cells are shaded horizontally, red being the highest
MAPS
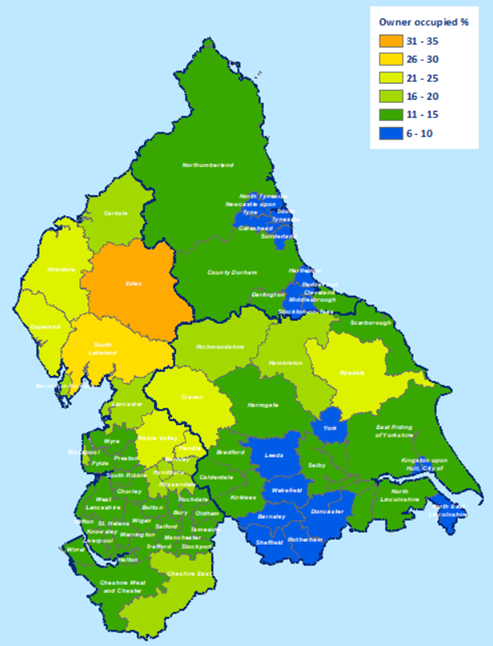
Note: Tenure maps are shaded to the same scale. This means that where the top or bottom of a range does not appear on a map the relevant shades are omitted from the map key.
Map 1 The proportion of private rented homes modelled with Category 1 Hazards
Map 2 The proportion of social rented homes modelled with Category 1 Hazards
Map 3 The proportion of owner occupied homes modelled with Category 1 Hazards